Nick Hodge,
Publisher
June 16, 2026
Editor’s Note: Below you will find a complimentary reprinting of the macro analysis in the June issue of Foundational Profits. It is a season of change for growth and inflation. We are buyers of several gold positions — including those outlined here. Subscribers also received two new buy recommendations as part of this issue. Details on select recommendations here. Enjoy. —Nick
This month we get multiple rotations.
While the Northern Hemisphere tilts toward the sun, the market hemisphere is going to tilt away from growth.
US gross domestic product has been moving higher since it contracted in Q4 2025, moving from 0.5% to 1.6% in Q1 2026 to the ~3% you’ll get for the current quarter (quarter-over-quarter, seasonally adjusted annual rate).
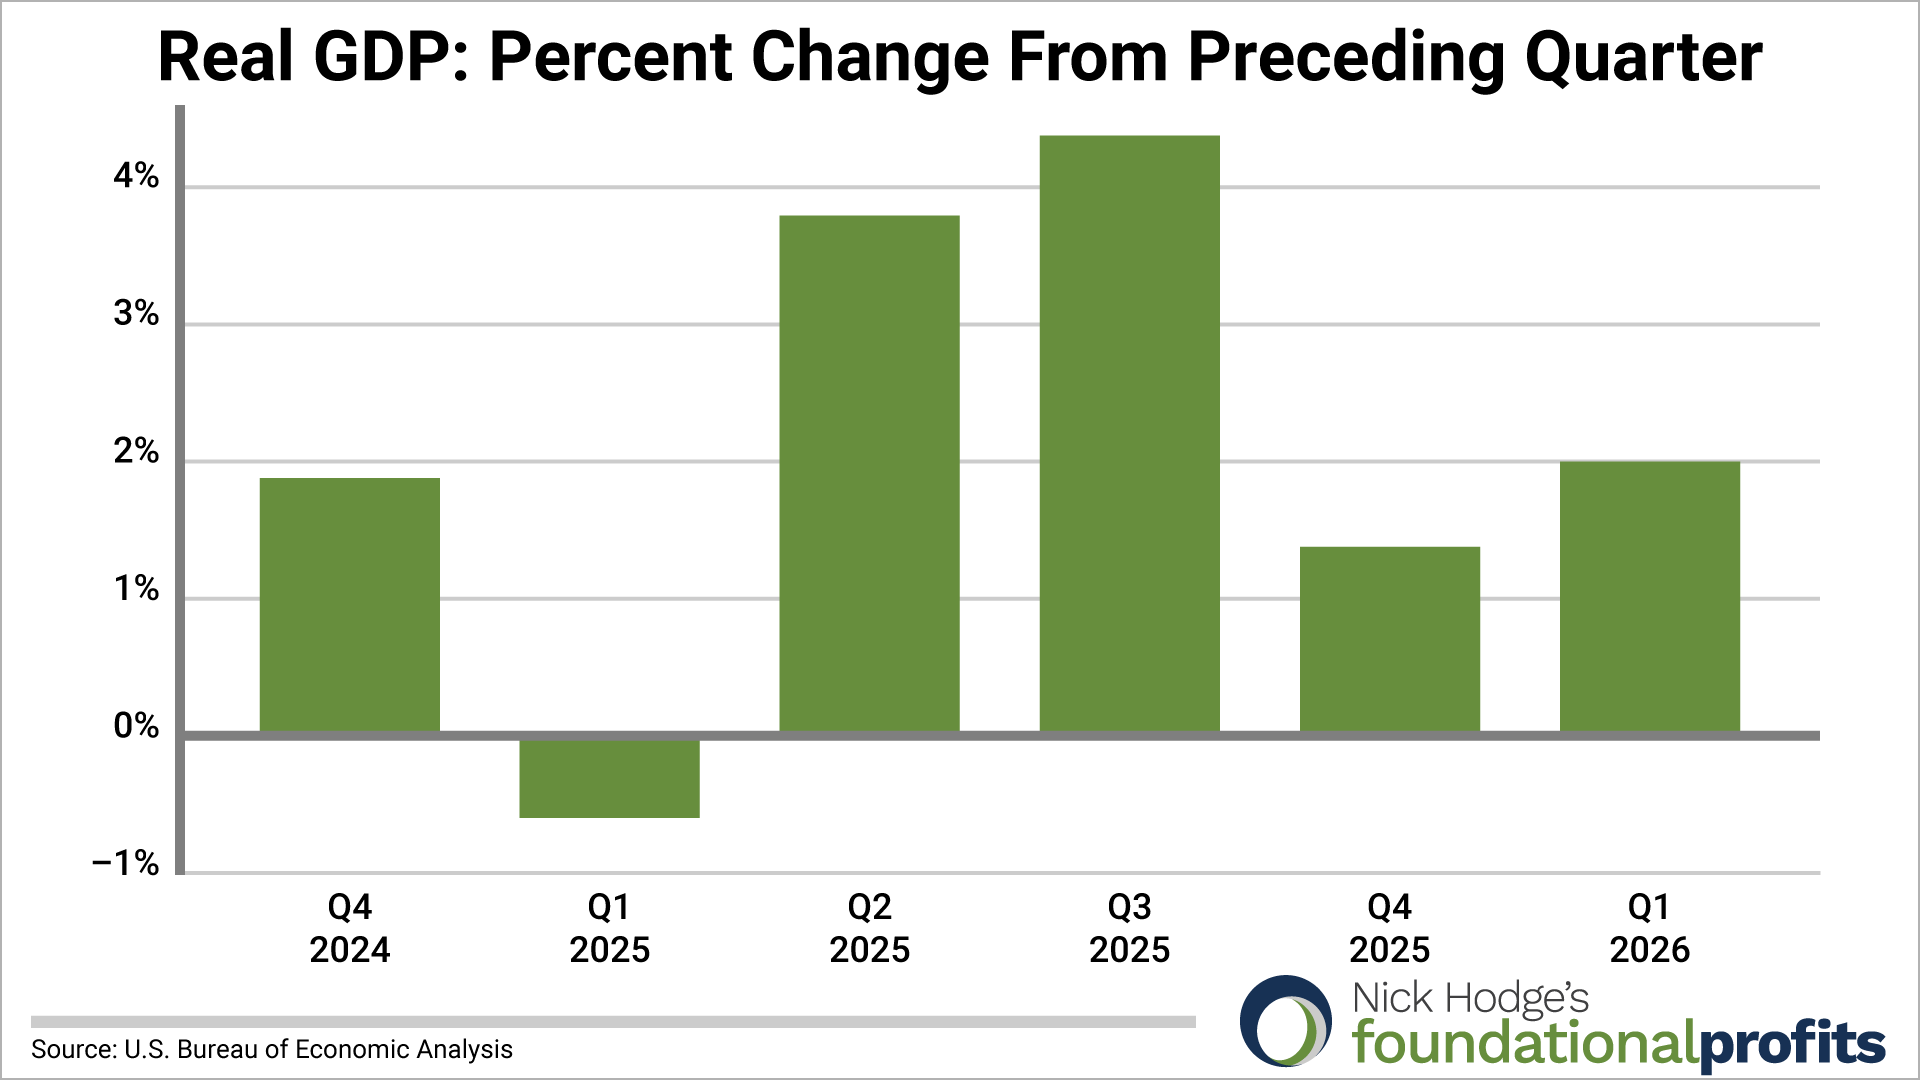
Next quarter will face tougher comparisons, as we printed 4.4% in Q3 last year. Not only that, but we are now digesting much higher oil prices that cause demand destruction and will likely lead to slower growth in the low-2% range for the next couple quarters.
Not only is economic growth set to slow, but earnings growth is set to slow after a recent acceleration as well.
FactSet numbers as of June 5 are showing 28.8% Q1 earnings growth for the S&P 500, driven by Information Technology and Communication Services at 54.8% and 48.9%, respectively.

Q2 earnings growth projections for the S&P 500 are at 21.7%, a meaningful slowdown driven by a large contraction in Communication Services (from 48.9% to 7.1%), Consumer Discretionary (from 40.8% to 4.8%), and Financials (from 21.8% to 4.2%).

Historically, this type of earnings deceleration has created a more challenging backdrop for equities. And we will be taking some profits in related sectors this month as a result.
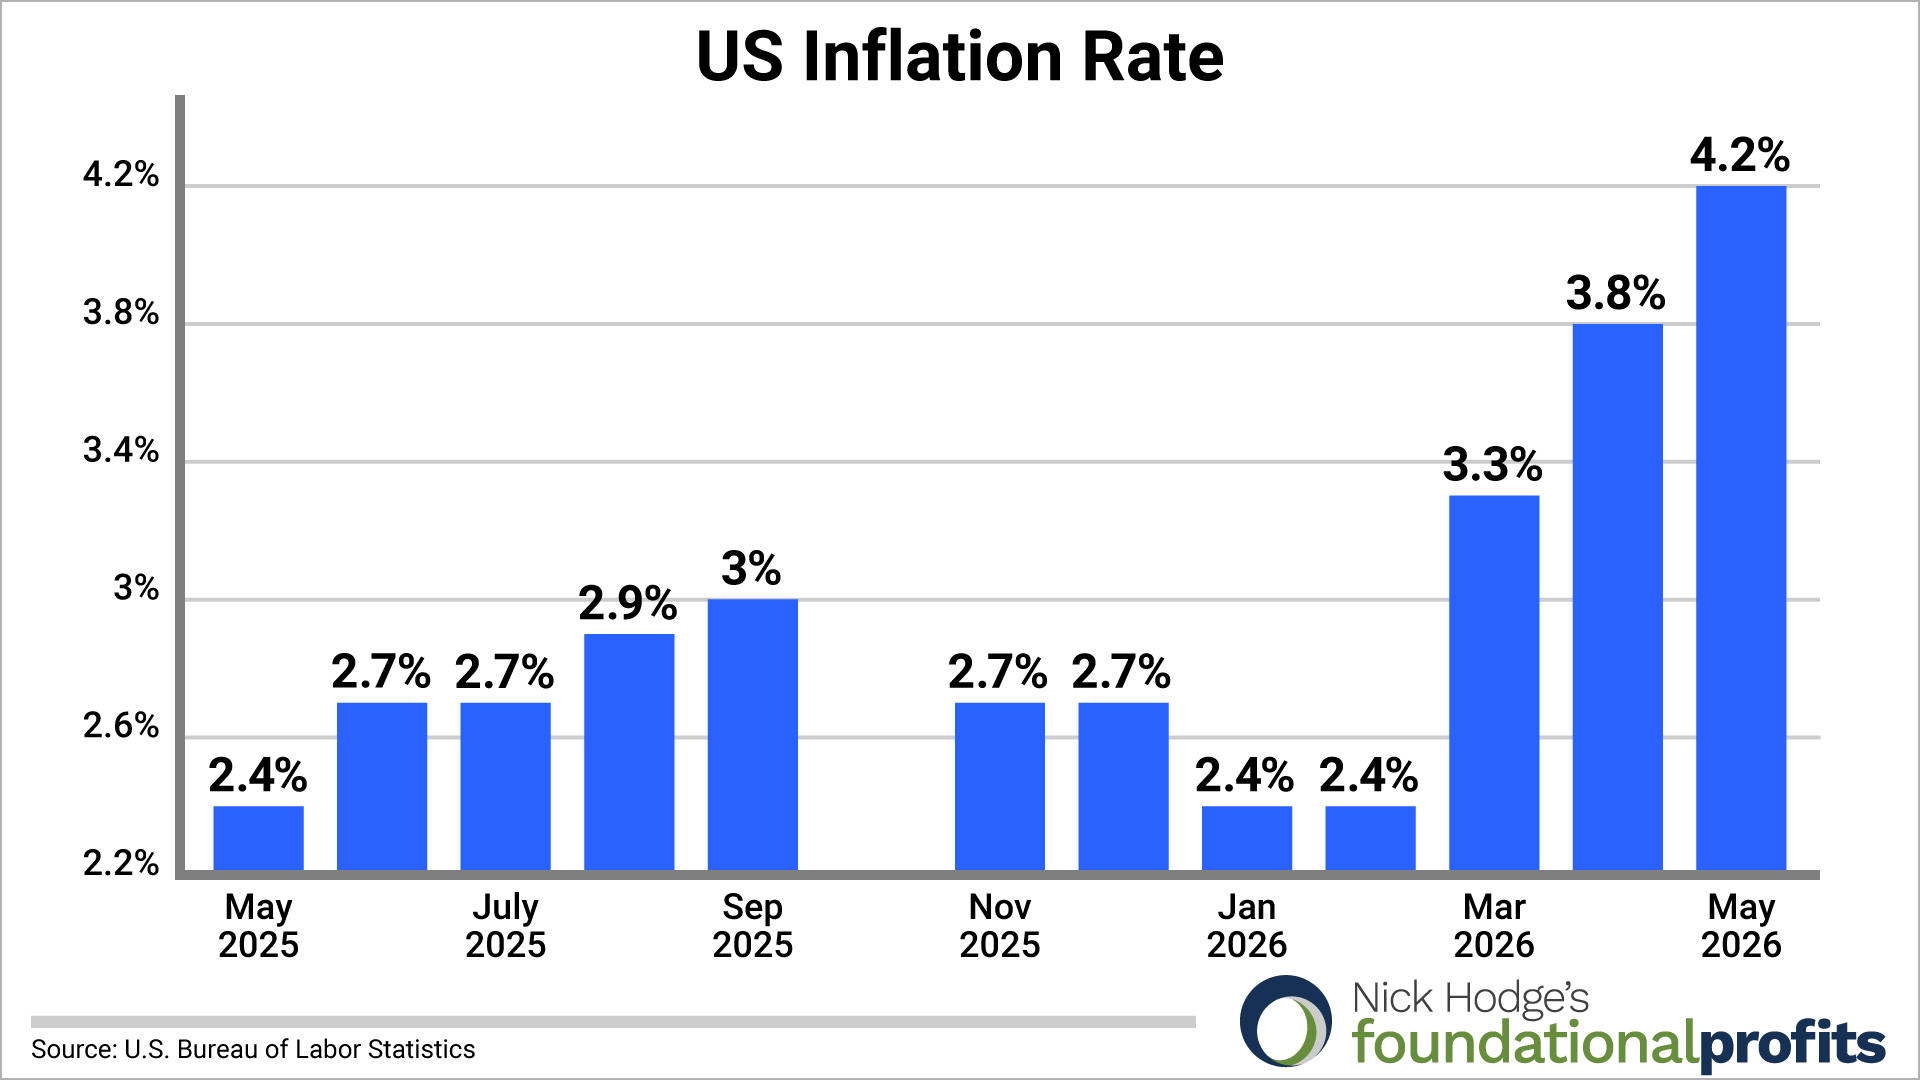
The wildcard for the next few months is going to be inflation, how much or if it cools, and how the market reacts to it. The CPI has been rising every month since Trump began bombing Iran, from 2.4% in February to the 4.2% print we just got for May.
The stock market is ok with inflation going up like that as long as there is commensurate economic growth, which there has been. That’s why the S&P 500 hit new all-time highs in April, May, and June.
What the stock market doesn’t like is inflation rising while growth is falling (stagflation) and, worse, when both inflation and growth are falling (deflation).
Because of the on-again off-again nature of the war and ceasefire with Iran, oil prices remain volatile and oscillating, which is making the crystal ball for inflation much murkier than for growth.
Oil volatility (OVX) remains up nearly 100% for the year significantly higher than gold volatility (GVZ) and S&P volatility (VIX).

Inflation’s direction in the second half of the year is likely going to hinge on the duration of the war and its impact on energy markets.
As it stands right now — though it can change instantly with a bomb or social post from Trump — both inflation and growth were higher in Q2. And with oil (WTI) down from $100 in April and May, we’ll likely see falling inflation for the next couple months with the CPI moving from May’s 4.2% down closer to 4%. This will be one of the macro factors I’m watching most closely in the second half.
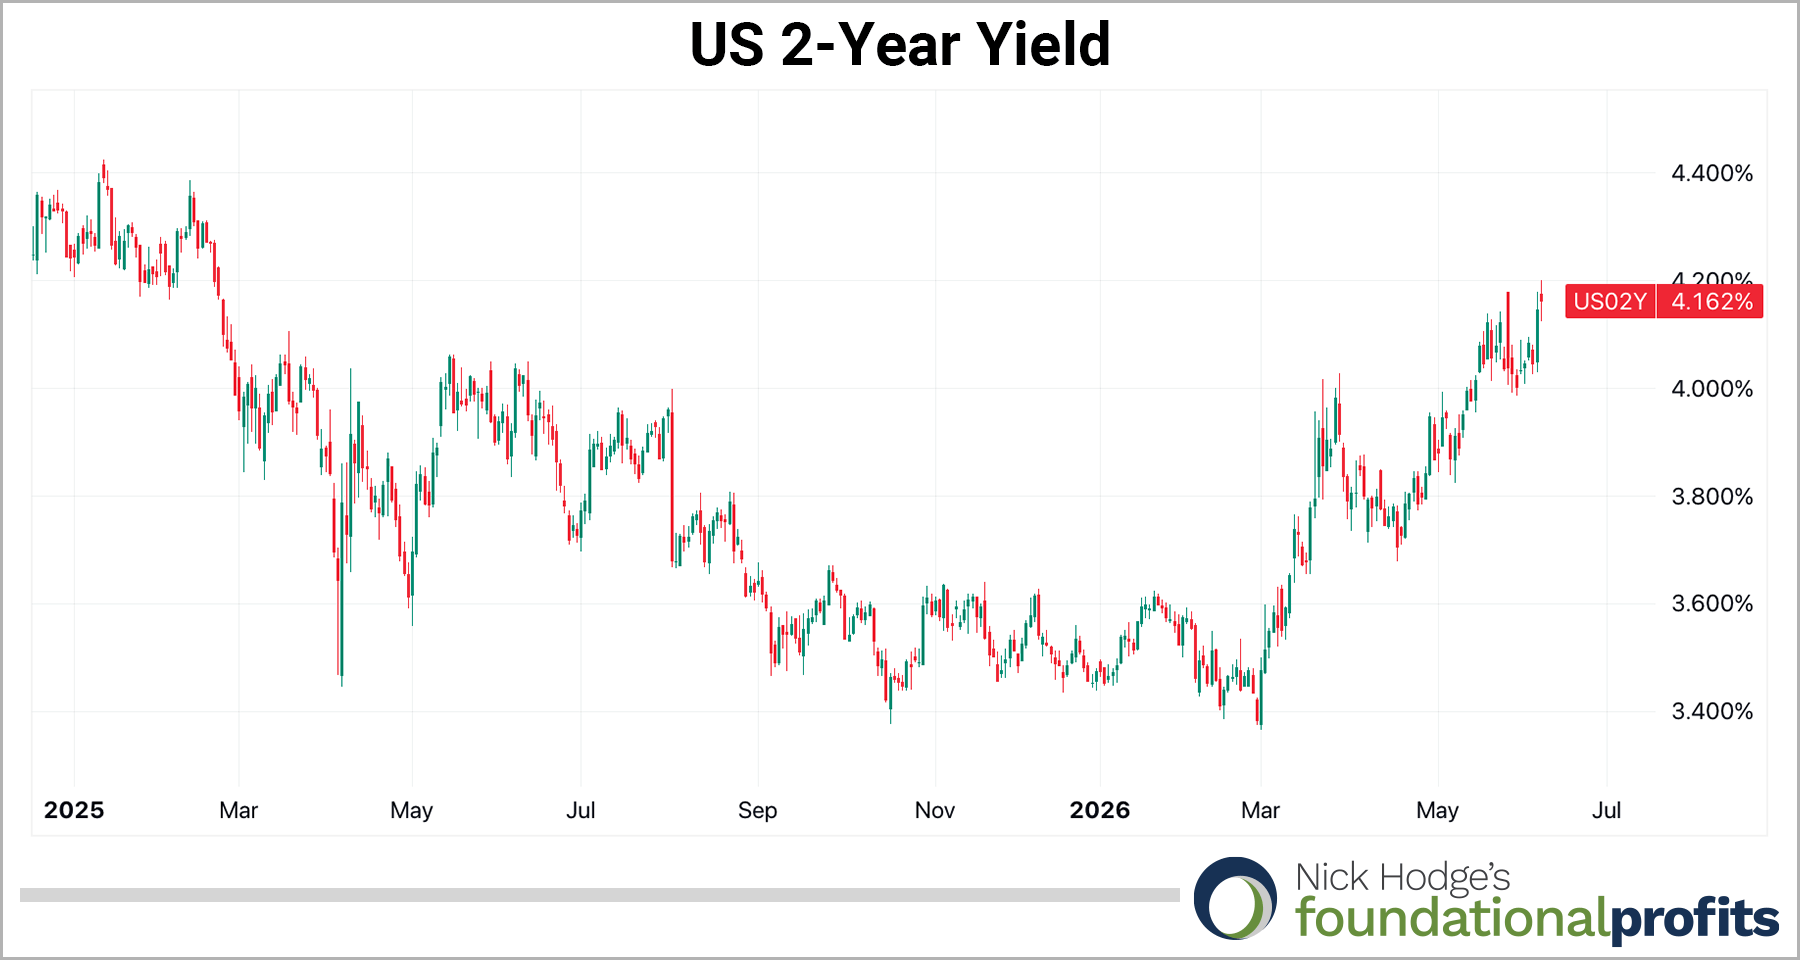
Beyond the next two months, short duration bonds think inflation is going to resume higher. The US 2-year yield moved to 16-month highs last week at 4.2%.
That portends a Fed hike as the next move to combat rising inflation. According to current CME Group probabilities, that quarter-point hike would come in December after no change from the current 3.5-3.75% target rate at the next four meetings.
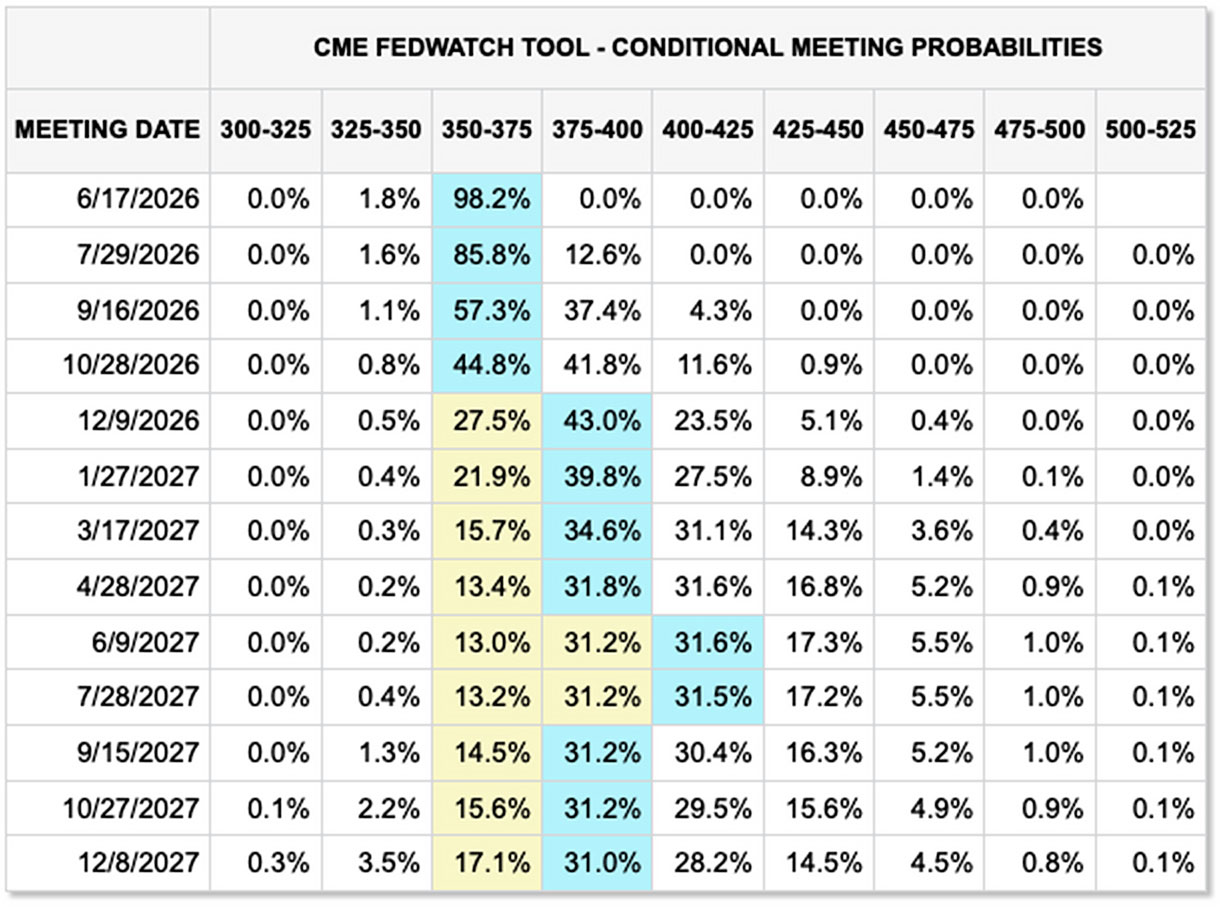
But at only a 43% likelihood, the only thing that’s clear is that the inflation situation for the remainder of the year is murky.
Indeed, many investors are playing wait and see or, because everything needs a catchphrase these days, they are “T-billing and chilling,” with Bloomberg reporting this month that, even with the stock market near record highs:
“…one of the most popular trades is to sit in cash or, more precisely, money-market funds. These plain‑vanilla vehicles, which invest in short‑term debt, have become the default parking spot for everyone from retail savers to corporate treasurers.
The US money-market industry now holds a record $8.29 trillion — almost twice the size of Japan’s economy — after inflows topped $1 trillion last year, according to Crane Data LLC, which tracks the industry. The strategy’s popularity has been accompanied by a Wall Street catchphrase, “T-bill and chill,” which has come to signify investors’ preference for the short-term Treasuries these funds often hold.”
Indeed, our cash position at Foundational Profits has risen from ~16% earlier this year (combined T-bills and collateralized loan funds) to ~26% last month as we sold chunks of profitable positions in April and May.
Latest on Gold, the Dollar, and Bonds
The dollar consolidated lower starting in April 2025, ultimately putting in a bottom in January this year. It has been in an uptrend since then, with the DXY probing the ~100 breakout level twice this year as capital moved to relative safety (see the money market note, above) pricing in the rotation in markets that we are now seeing. Previous support near 100.2 is now resistance that will be tested.
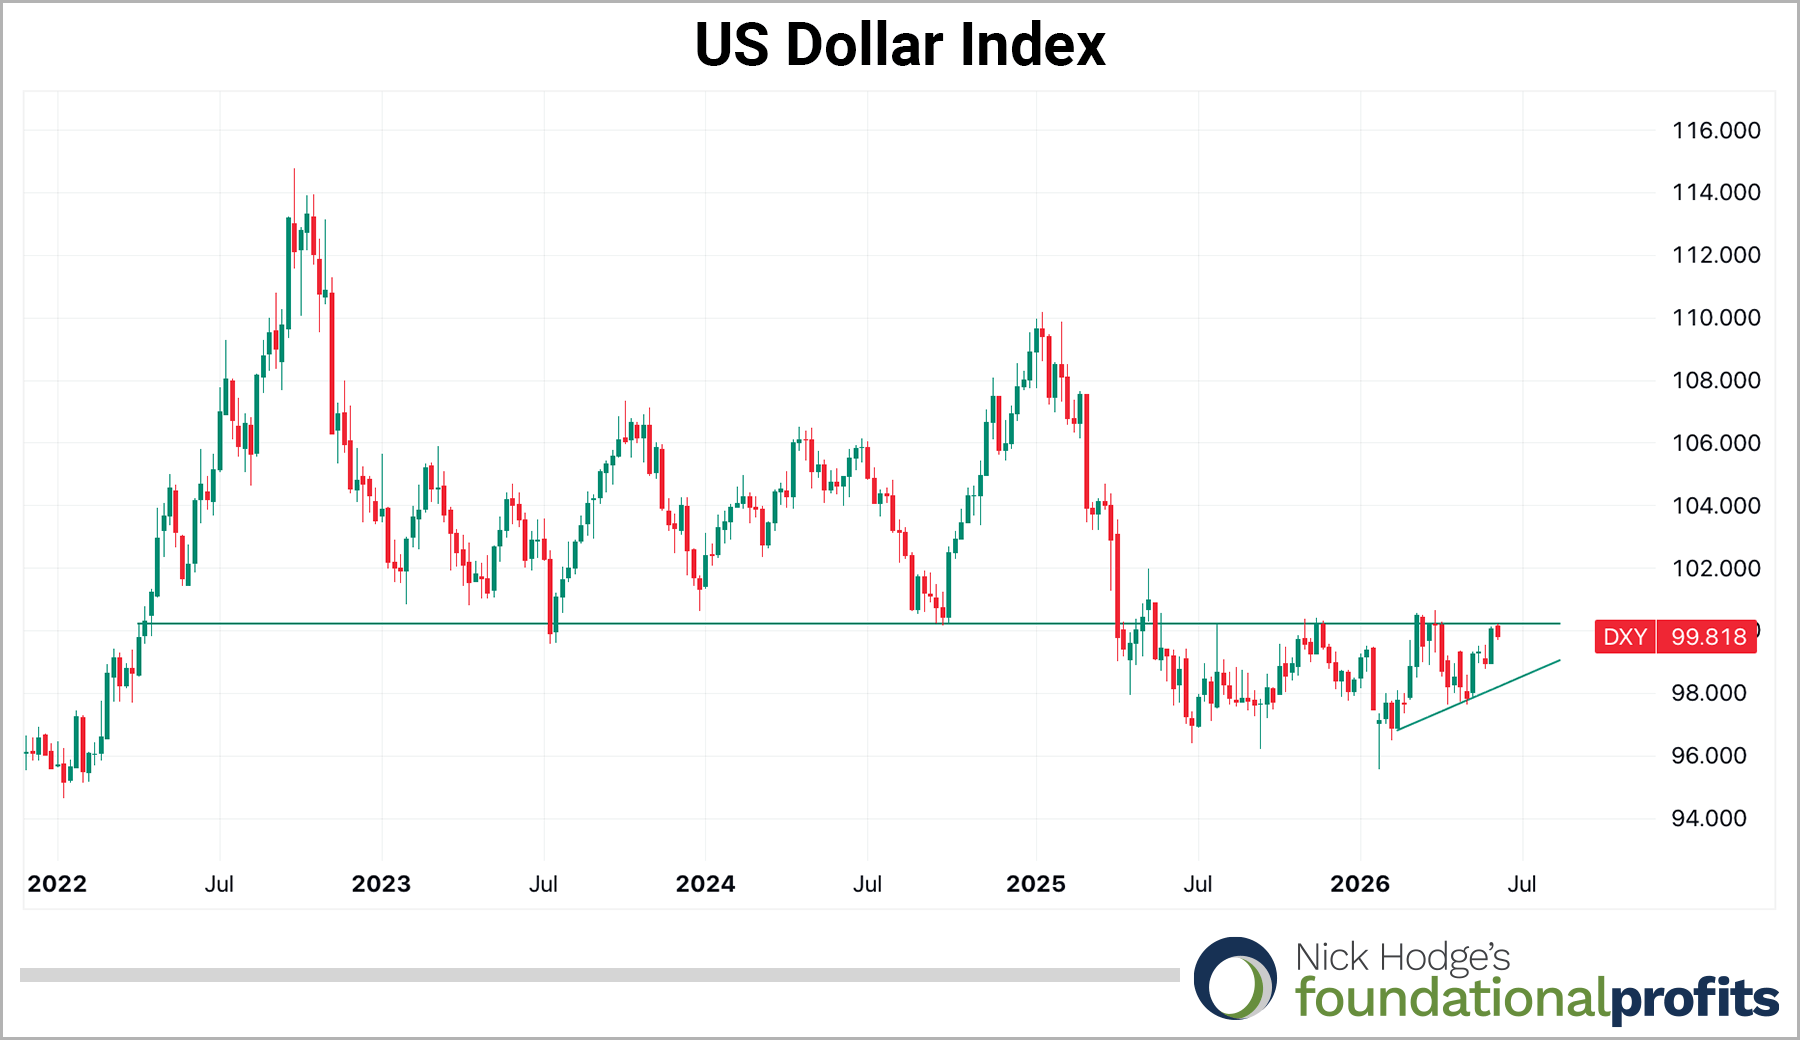
The dollar started rising when the bombs started dropping.
Similarly, bond yields started rising at the same time, with the 10-year up as much as 75 basis points and the 2-year up as much as 83 basis points since the first week of March. This flattening of the yield curve — with only 40 basis points of separation versus 68 at the start of the year — is clear evidence of market uncertainty and a transition from expanding to slowing growth.

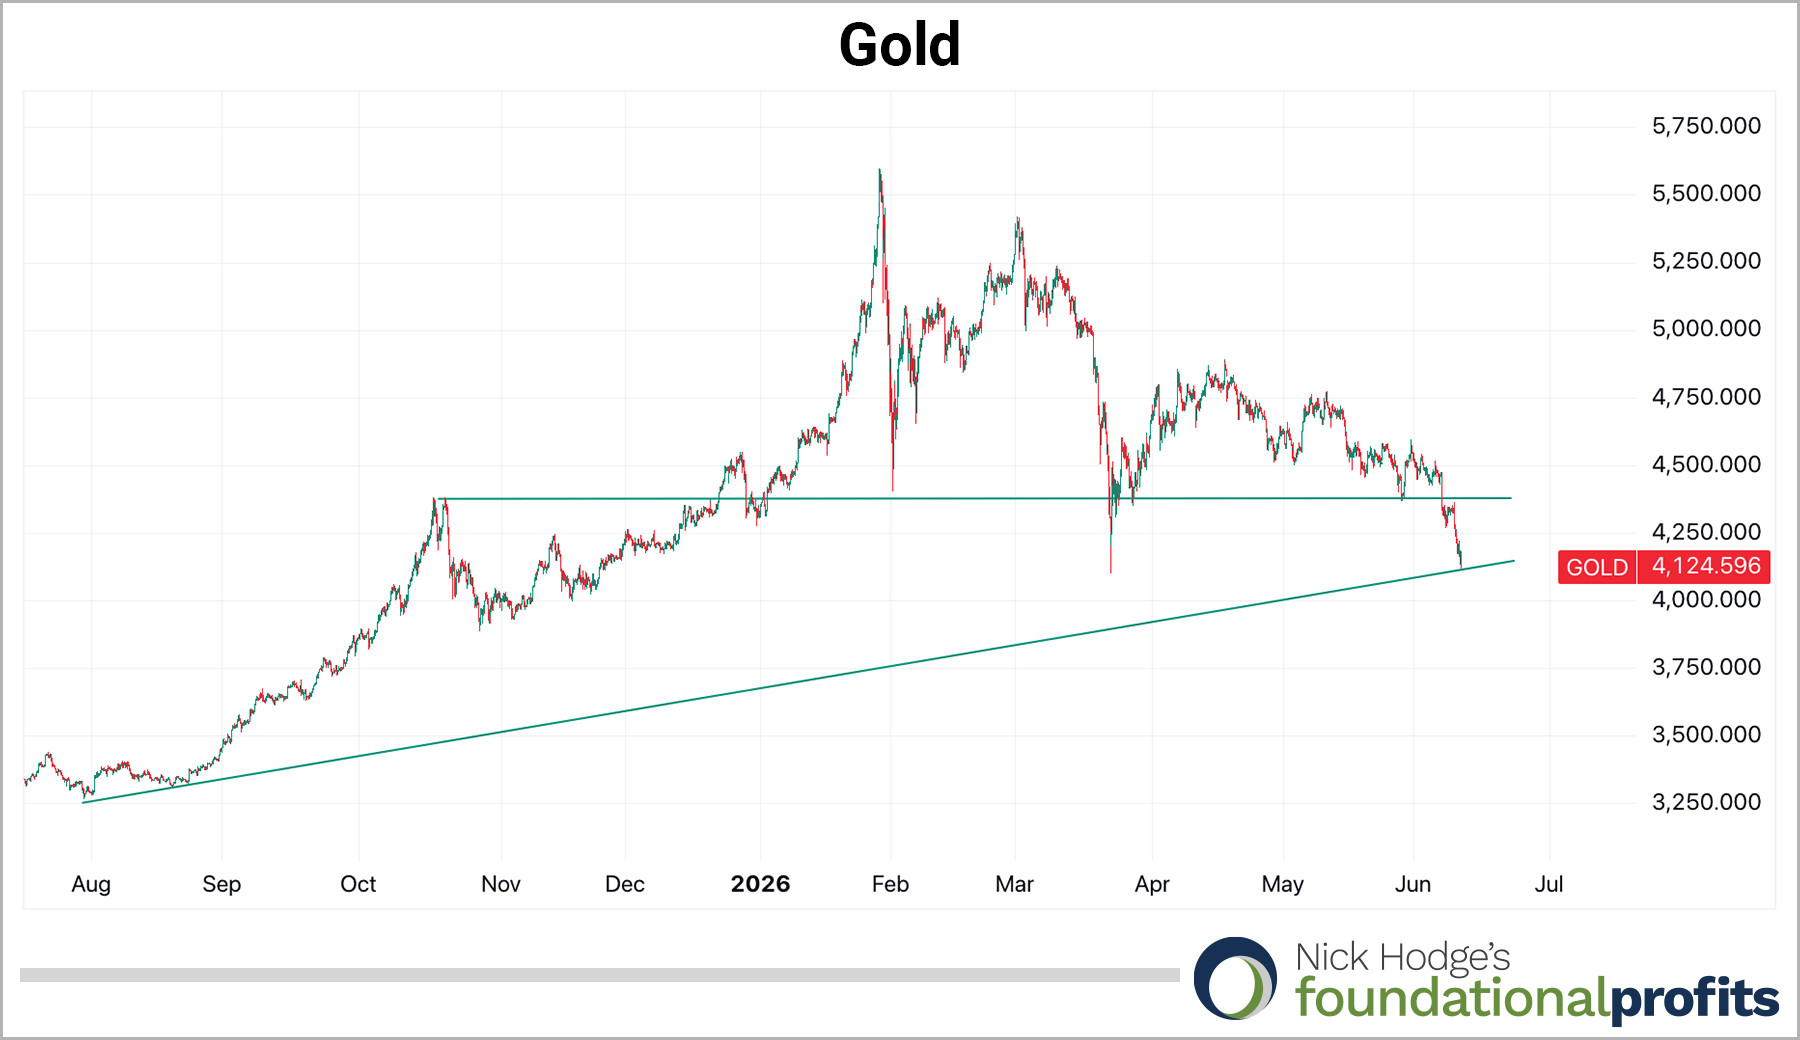
This strengthening dollar and yield environment has put pressure on the precious metals and commodity complex, with gold falling below near-term support at the ~$4,375 level and now testing its trendline at ~$4,120. Technically, breaking below current levels would put the $3,890-$3,990 level in play.
On the gold equity front, things are getting oversold. Scotiabank put out a note on June 10 titled, “Attractive Gold Valuations: Time to Buy?,” which noted:
We have analyzed several valuation metrics (FCF Yield, EV/EBITDA, P/CF and P/NAV) to see where gold equities are trading today versus past valuation (data back to 1970s). In short, the gold equities are trading at very attractive valuations on these 4 metrics (at spot gold commodity prices) versus historical levels.
We have recently added to our holdings in gold producers and developers at current levels, and these Gold Script companies are now worth a look as they trade with a discount.
Call it like you see it,

Nick Hodge
Publisher, Bizarro World